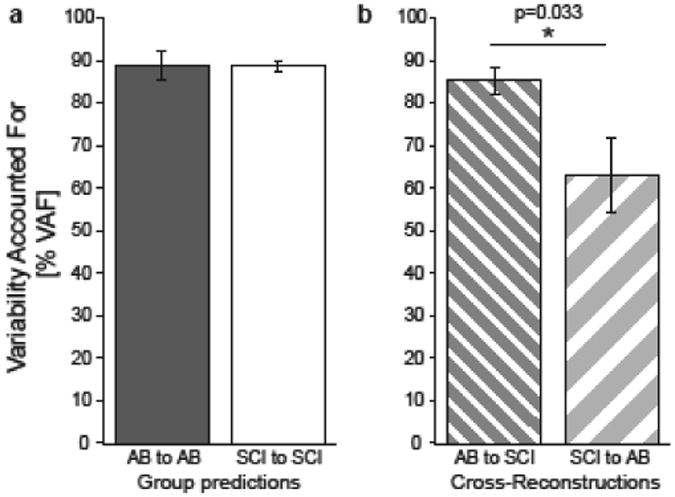
Figure 7. Inter-group ICA/PCA reconstructions reveal differences in SCI and AB group coordination patterns.

Each bar represents the mean ± standard error variability accounted for (VAF) when one groups' muscle coordination patterns are used to reconstruct the data from the individuals in that group (left) or the other group (right). Statistical significance is indicated by an asterisk (p< 0.05) and double asterisk (p<0.01) for between-group comparisons. For both groups, the VAF by group patterns is not different from 90% (p>0.05). SCI muscle coordination patterns have lower VAF when reconstructing AB group EMG data (p=0.003).
