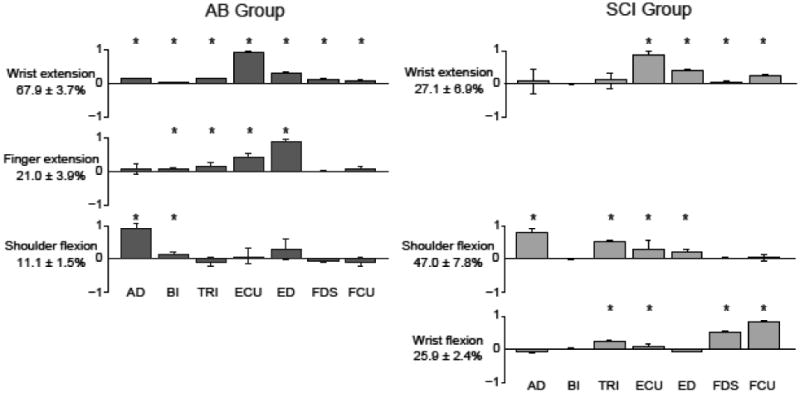
Figure 8. Comparison of muscle coordination patterns between AB and SCI groups.

Muscle coordination patterns are shown for the AB control (left) and SCI (right) groups. Muscles in each coordination pattern are indicated at the bottom for each bar. Bar heights correspond to the relative activation of each muscle normalized to unity for a given pattern. Percentages at the left of each pattern indicate the relative variance accounted for by that pattern across the whole group dataset. Both groups use a shoulder flexion and a wrist extension pattern. However, the SCI group exhibits a unique wrist flexion pattern, while the AB group showed a more task-appropriate finger extension pattern.
