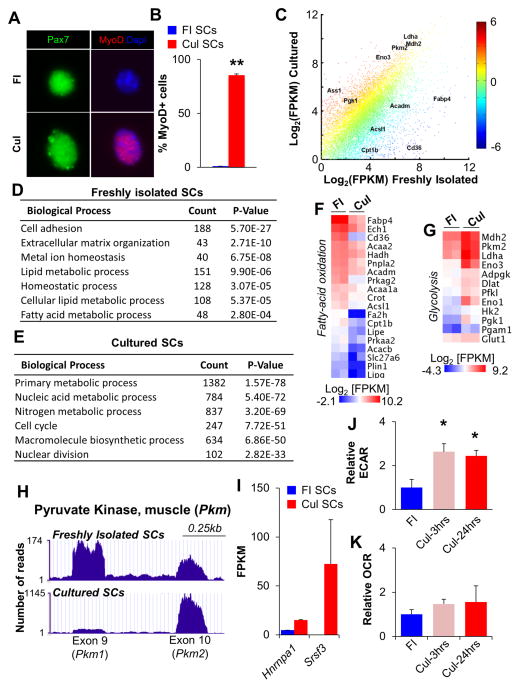
Figure 1. Satellite Cells Undergo a Switch from Oxidative to Glycolytic Metabolism Following Culture in Growth Media.
(A) Immunofluorescent analyses of freshly isolated (FI, quiescent) and cultured (Cul, activated) SCs with Pax7 (green) and MyoD (red) antibodies. Dapi identifies nuclei. (B) Quantification of MyoD+ SCs in FI and Cul cell populations. (C) RNA-seq scatter plot with key metabolic regulators indicated. Each data point represents the mean Log2[FPKM] from two independent biological replicates with color indicating the relative fold change in gene expression. (D,E) Gene ontology analyses of RNA-seq revealed an enrichment of biological processes specific to FI SCs (D) or Cul SCs (E). The number of genes enriched by greater than 1.5-fold is indicated under the ‘Count’ column. (F,G) Heat maps indicating absolute gene expression (Log2[FPKM]) of specific metabolic regulators in FI and Cul SCs. Each gene listed had a mean fold-change of greater than 1.5. (H) RNA-seq traces (UCSC genome browser) for Pkm 1 and 2 isoforms in FI and Cul WT SCs. (I) Expression of the Pkm splice regulators Hnrnpa1 and Srsf3 in FI and Cul SCs. (J,K) Cellular bioenergetics in SCs during culture in growth conditions were evaluated with Seahorse XF96 bioanalyzer. Glycolysis (ECAR) was increased 2.5 fold in Cul-3hrs and Cul-24hrs SCs (J), while basal oxygen consumption (OCR) was not different between FI, Cul-3hrs or Cul-24hrs SCs (K). Data are presented as mean ± SEM. *p < 0.05 and **p < 0.01 (FI SCs versus Cul SCs).

