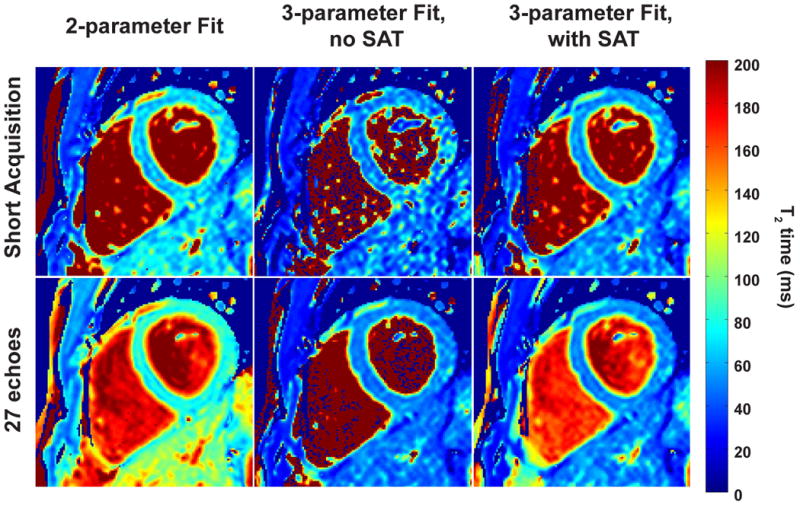
Figure 7.

Example T2 maps from a healthy adult subject (No. 3), generated using 2-parameter fitting (left column), 3-parameter fitting without SAT image (middle column) and the proposed 3-parameter with SAT image (right column) with the short acquisition and using all 27 (top and bottom row respectively) T2prep echoes. The myocardial T2 value increases when going from 3 to 27 echoes using the 2-parameter fit. For the short acquisition, the T2 map generated using the 3-parameter fit without SAT image has 1.8-fold more variation in the septum compared to that generated using the proposed 3-parameter fit with SAT image. When using all 27 T2prep echoes, the 3-parameter fits with and without SAT image leads to similar quality in the myocardium.
