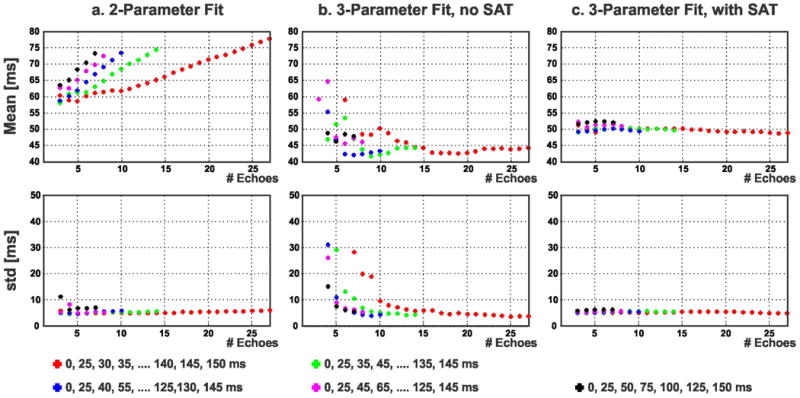
Figure 8.

Myocardial T2 values from the same subject in Figure 7 (averaged over an ROI in the septum) using 2-parameter fit, 3-parameter fit without SAT image and the proposed 3-parameter fit with SAT image, on various subsets of image corresponding to different T2prep echo times. The 2-parameter model (a) shows dependence on the choice and number of T2prep echo times. The 3-parameter fit without SAT image (b) converges to the T2 value with a large number of T2prep echoes, but shows deviations otherwise. The proposed 3-parameter fit with the SAT image (c) results in T2 values that are almost constant (variation: 3.6 ms) over different subsets of T2prep echo times.
