
Figure 1.
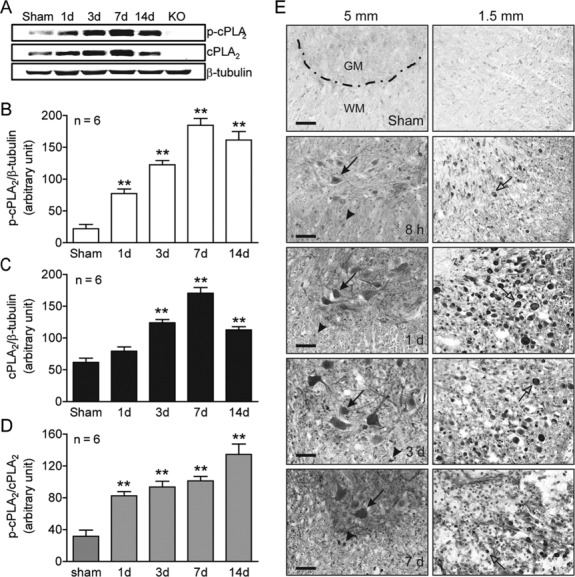
Cytosolic phospholipase A2 (cPLA2) activation following spinal cord injury. (A) Representative time courses of phosphorylated cPLA2 (p-cPLA2), cPLA2, and β-tubulin expression. (B) Compiled results in a bar graph for the ratio of p-cPLA2/β-tubulin expression. (C) Compiled results in a bar graph for the ratio of cPLA2/β-tubulin expression. (D) Compiled results in a bar graph for the ratio of p-cPLA2/cPLA2 expression. **p < 0.01 versus sham (1-way analysis of variance, Dunnett post hoc test, n = 6 mice/group). Error bars represent mean ± standard error of the mean. (E) Immunohistochemistry of mouse spinal cord sections at 1.5 and 5mm caudal to the injury epicenter shows increased p-cPLA2 expression in neurons (arrows), axons (open arrows), and glial cells (arrowheads). GM = gray matter; KO = knockout; WM = white matter. Bars = 40μm.