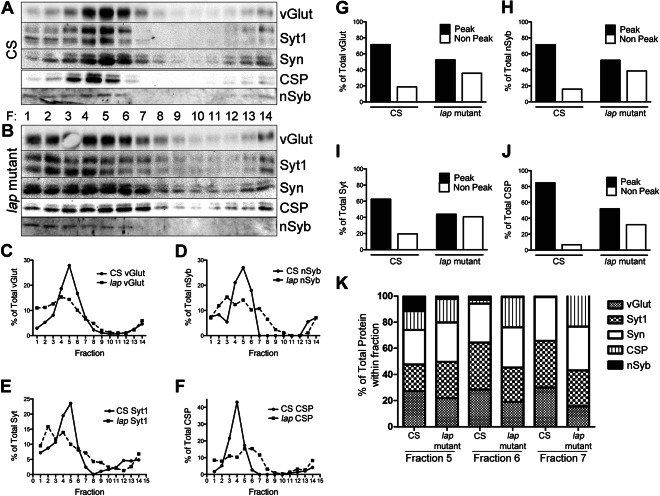
Figure 8. Distinct populations of SVs with different levels of SV proteins are present in lap mutants.
Total brain lysate was isolated from 3- to 5-day-old adult wild-type (CS) or lap (lap1/lapsd3) mutant flies. The lysate was separated over a 5–25% glycerol gradient. A total of 14 fractions were collected from the top, diluted in SDS sample buffer, separated over an SDS–PAGE gel, transferred to nitrocellulose and probed with the indicated antibodies. A and B) In control flies, SVs proteins are enriched primarily in fractions 3–6. While these fractions also contain SV proteins in lap mutants, these proteins are also seen to migrate into the less dense fractions 1–7. C–F) Graphical representation of data in A and B. Protein density was measured using ImageJ. Data are plotted as the percentage of protein in each fraction to total protein level for each respective protein. G–J) To determine the percentage of protein found in either peak (4–6) or non-peak (1–2) fractions, the protein density was summed for their respective fractions and plotted as a percentage of total protein in all fractions. Although ∼70–80% of the total SV protein is found in peak fractions of control lysates, only ∼50% of total SV protein is found in these fractions of lap mutants. Conversely, less than 20% of total SV protein is found in non-peak fractions of control flies, whereas ∼40% is found in these fractions of lap mutants. K) Histogram plots of percentage of SV proteins in fractions 5–7. These data show clear differences in SV protein compositions between the control and the lap mutant.

