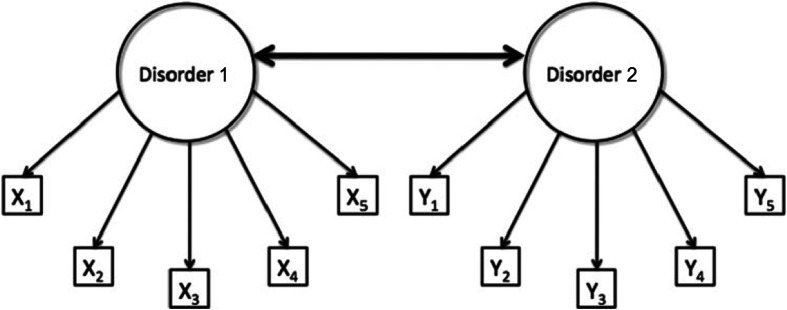
Fig. 1.
A model of comorbidity between disorders 1 and 2, under the standard assumptions of latent variable modeling. The circles represent the disorders (i.e., latent variables) and the rectangles represent the observable core symptoms of those disorders (i.e., X1–X5 for disorder 1, and Y1–Y5 for disorder 2). In this model, comorbidity is viewed as a correlation between the latent variables, visualized by the thick bidirectional edge between disorders 1 and 2 (Figure from Cramer et al. [21] with minor adjustments; reprinted with permission)

