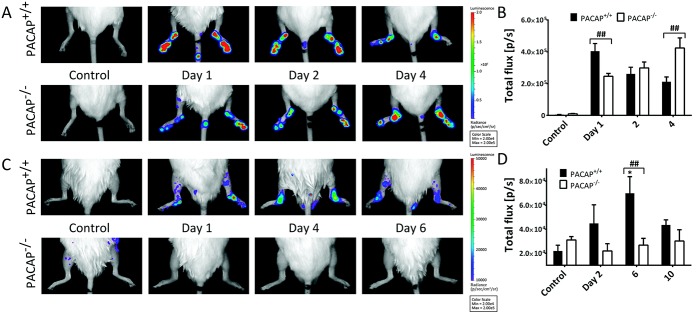
Figure 3.

Bioluminescence imaging of neutrophil-derived myeloperoxidase activity and macrophage-derived superoxide activity. A and B, Representative images of luminol activity obtained 10 minutes after intraperitoneal injection of Na-luminol (150 mg/kg) (A) and quantification of luminescence in diseased ankle joints (B). C and D, Representative images of lucigenin-based superoxide detection (C) and quantification of luminescence in diseased ankle joints 10 minutes after intraperitoneal injection of lucigenin (25 mg/kg) (D). Values in B and D are the mean ± SEM photons/second (p/s) (n = 4−6 per group). ∗ = P < 0.05 versus control PACAP+/+ mice; ## = P < 0.01. Color figure can be viewed in the online issue, which is available at http://onlinelibrary.wiley.com/doi/10.1002/art.38772/abstract.
