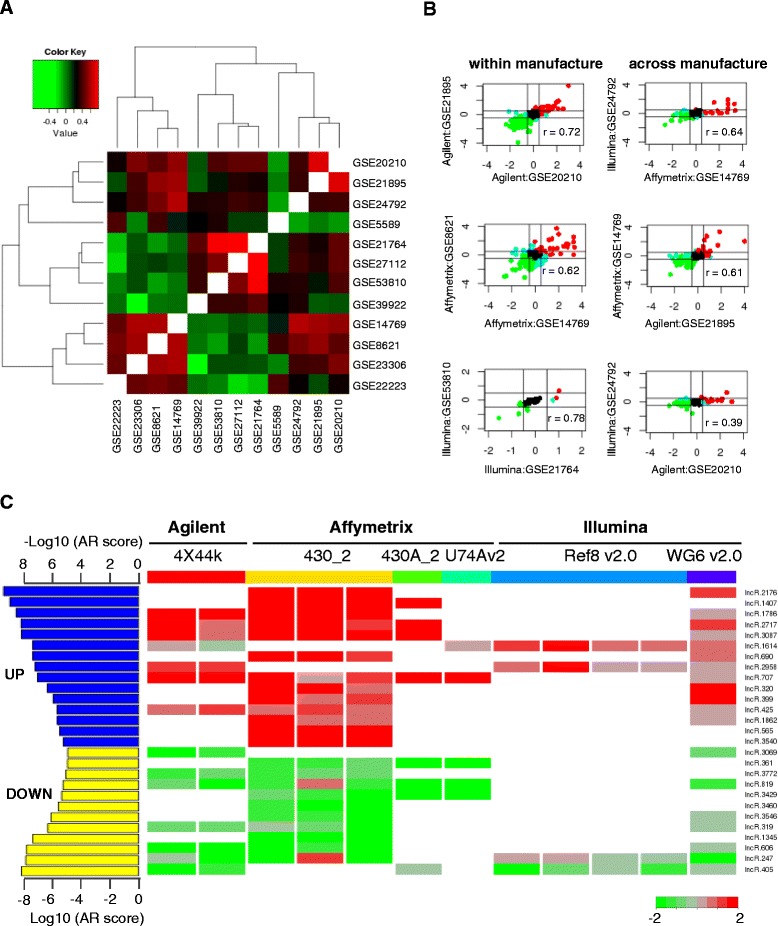
Figure 2.

Correlation between different microarray datasets and integratation of LPS-regulated lncRNAs from all the datasets. (A) Heatmap showing the Pearson correlation value between all the possible pairs of microarray datasets. (B) Represented correlation of the log2 expression change of LPS-regulated lncRNAs within (left panel) and across manufactures (right panel). (C) The right panel is the heatmap of Log2 expression change of 27 significantly changed lncRNAs upon LPS-stimulation. The fold change was scaled to −2 to 2 by setting all values more than 2 or less than −2 to 2 and −2, respectively. The lncRNAs list was defined by Bonferroni-adjusted p value cutoff 0.05, which was calculated from a robust rank aggregation (RRA) algorithm. On the left panel, the aggregation rank score (AR score) from RRA was shown. AR score indicated the integrated rank from the integrated analysis of fold change from 12 different microarray datasets. For upregulated lncRNAs, −Log10(AR score) was used while for downregulated lncRNAs, Log10(AR score) was used.
