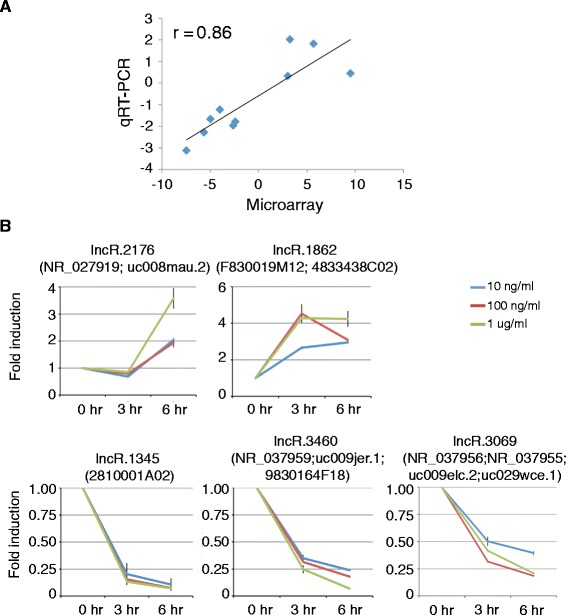
Figure 3.

qRT-PCR validations of LPS-regulated lncRNAs from integrated microarray datasets. (A) Correlation analysis of averaged log2 (fold change) derived from qRT-PCR and +/− log10(AR score) derived from integrated microarrays as shown in Figure 2C. (B) The relative expression levels of two upregulated and three downgregulated lncRNAs identified by integrated analysis in BMDMs stimulated with 10 ng/ml, 100 ng/ml and 1 ug/ml LPS for 0, 3 and 6 hours.
