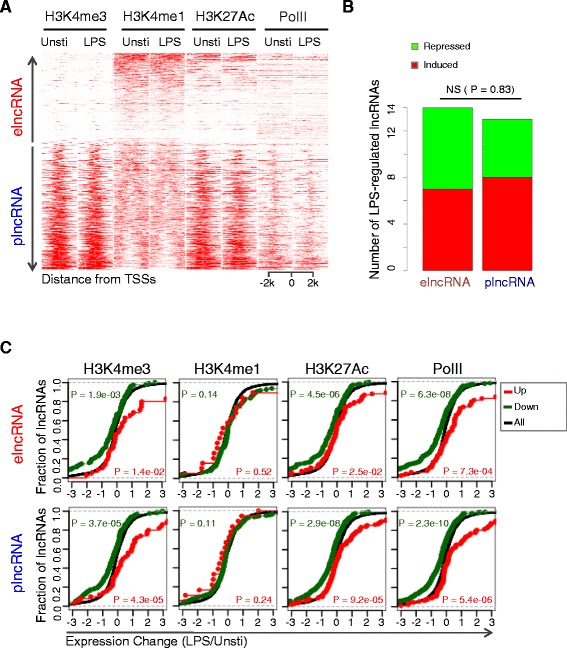
Figure 4.

Chromatin signatures surrounding TSSs separate lncRNAs into elncRNAs and plncRNAs. (A) Heatmap presenting the read intensities of H3K4me3, H3K4me1, H3K27Ac and PolII modification across a 4 Kb interval centered on TSSs of the 994 lncRNAs before and after LPS stimulation in BMDMs (the y-axis indicates 994 lncRNAs and the label was not shown, refer to Additional file 13). (B) The numbers of LPS-upregulated and -downregulated lncRNAs among elncRNAs and plncRNAs showed by bar chart. The P value was calculated by chi-square test. (C) Empirical cumulative distribution function (ecdf) plot was showing to indicate the correlation between the change epigenetic markers (H3K4me3, H3K4me1, H3K27Ac and PolII) and the expression change of their corresponding lncRNAs. Upper panel is elncRNAs, while lower panel is plncRNAs. The red and blue curves represent lncRNAs that were marked with increased and decreased epigenetic markers, respectively. Black curve represent all lncRNAs. Based on the knowledge that all these four epigenetics marks are active markers that positively correlated with expression changes, one-sided KS-test was performed to evaluate the difference between red curve and black curve, and similarly the difference between blue curve and black curve was evaluated.
