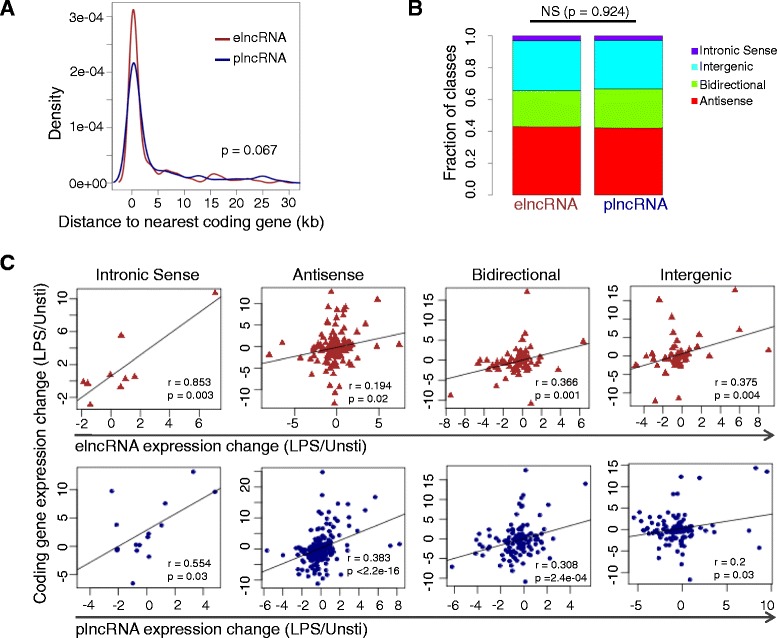
Figure 5.

Comparison of distance and correlation to closest neighboring protein-coding gene between elncRNAs and plncRNAs. (A) Density distribution of distances from the nearest neighboring protein-coding genes for elncRNAs and plncRNAs (P value is from t-test). (B) Percentages of sense, antisense, bidirectional and intergenic lncRNAs for elncRNAs and plncRNAs. (C) Expression change correlation of closest neighboring protein-coding gene and elncRNAs (upper panel) and plncRNAs (lower panel).
