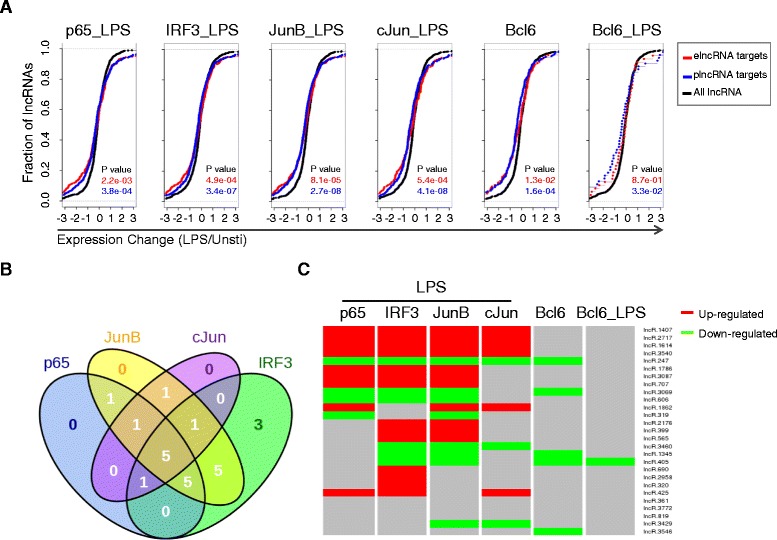
Figure 7.

The cooperated regulation of transcription factors on lncRNAs upon LPS stimulation in BMDMs. (A) Ecdf plots demonstrate the expression difference between transcription factor targets (red: elncRNA; blue: plncRNA) and all lncRNAs (black) (P values are from two-sided KS-test). (B) Venn diagrams of the numbers of overlapped lncRNAs bound by p65, IRF3, JunB and cJun upon LPS stimulation in BMDMs. (C) Heatmap showing that whether LPS-upregulated (red) and LPS-downregulated (green) lncRNAs were bound by transcription factors p65, IRF3, JunB, cJun and Bcl6. The red and green colors mean the lncRNAs were bound by the corresponding transcription factor, while the gray color means not bound.
