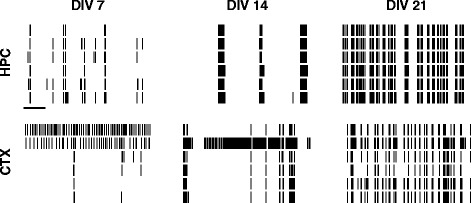
Figure 1.

Examples of spontaneous activity in developing cultures. Top row: Hippocampal (HPC) cultures. Bottom row: Cortical (CTX) cultures. Each column represents one day in vitro (DIV). Within each raster plot, one row represents the spike train from one electrode; six (out of typically 59) electrodes are shown. Scale bar for all rasters is 10 s. CTX, cortex; DIV, days in vitro; HPC, hippocampus.
