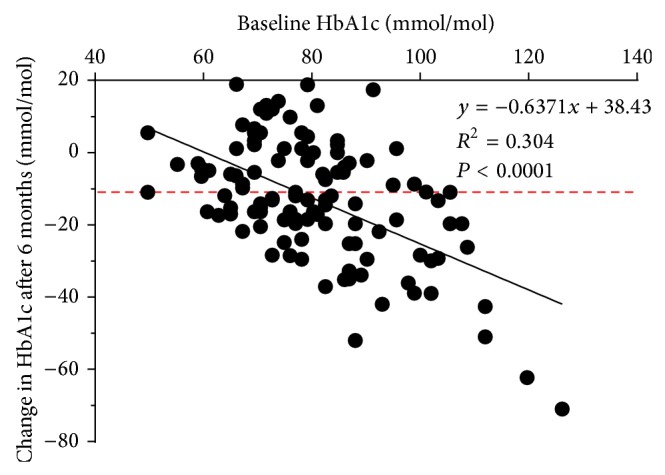
Figure 2.

Relationship between the baseline HbA1c and changes in HbA1c after six months of exenatide therapy. Results are shown with the equation for the line of best fit, the R 2 value quantifying the goodness of fit, and the P value showing statistical significance. Dashed line indicates the 11 mmol/mol point which is the reduction required for individuals to be classed as responders to exenatide. Abbreviations: HbA1c, glycated haemoglobin.
