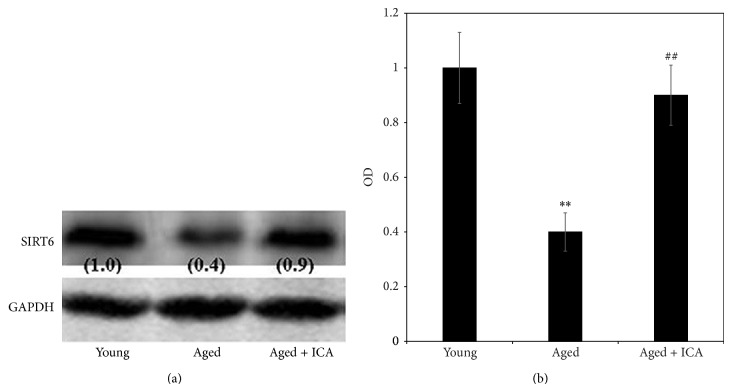
Figure 2.
(a) shows a band of the expected size corresponding to SIRT6 protein in murine heart tissue extract prepared from 3-month old mice (young), 24-month old mice (aged), and 24-month old mice treated with ICA (aged + ICA). Numbers in brackets are the normalized OD (optical density) values. (b) shows the OD (optical density) comparison of SIRT6 protein expression in heart tissue (fold of control value). Note: aged group compared with the young group, ** P < 0.01; aged group compared with the aged + ICA intervention group, ## P < 0.01.

