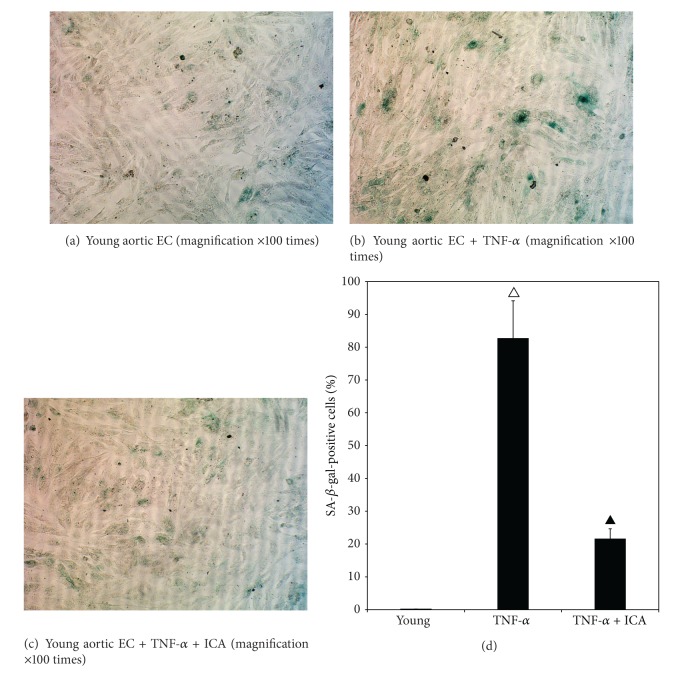
Figure 4.
Detection of SA-β-Gal in mouse aortic ECs isolated from young mice (3 months old) and treated with TNF-α and ICA. (a) shows a microphotograph with SA-β-Gal stained cells under bright-field illumination. Very few blue cells were detected in the field, with the young control group. (b) shows that increased numbers of blue-stained SA-β-Gal cells were present in young + TNF-α-treated group. (c) shows a qualitative decrease in the number of blue-stained SA-β-Gal cells in the young + TNF-α + ICA intervention group compared with the young + TNF-α group. (d) shows the quantitation of the percentage of SA-β-gal-positive cells in all fields counted. Young + TNF-α compared with the young group, △ P < 0.01; young + TNF-α + ICA compared with the young + TNF-α-treated group, ▲ P < 0.01.

