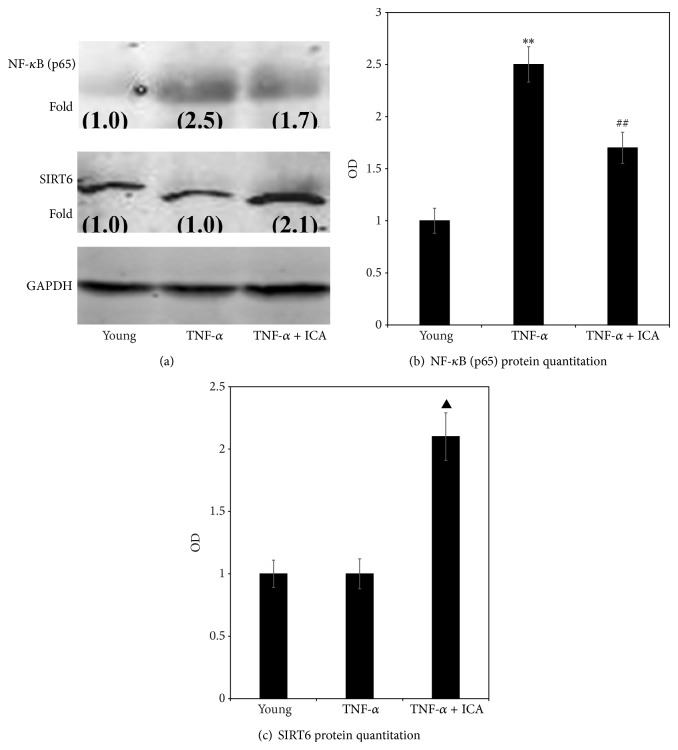
Figure 5.
(a) shows a western analysis with band sizes corresponding to NF-κB (p65) and SIRT6 protein, which were obtained from aortic ECs sampled in the young group (young), young treated with TNF-α group (+TNF-α), and young treated with TNF-α + ICA intervention group (TNF-α + ICA). Numbers in brackets are normalized OD (optical density) values, where the value of 1.0 was set for the young group. (b) shows OD comparison of NF-κB (p65) protein expression in aortic ECs (fold increase over the young value set at 1.0). Compared with young cells, ** P < 0.01; compared with young cells + TNF-α, ## P < 0.01. (c) shows OD comparison of SIRT6 protein expression in aortic ECs (fold increase over the young value set at 1.0). Young + TNF-α + ICA compared with young + TNF-α, ▲ P < 0.01.

