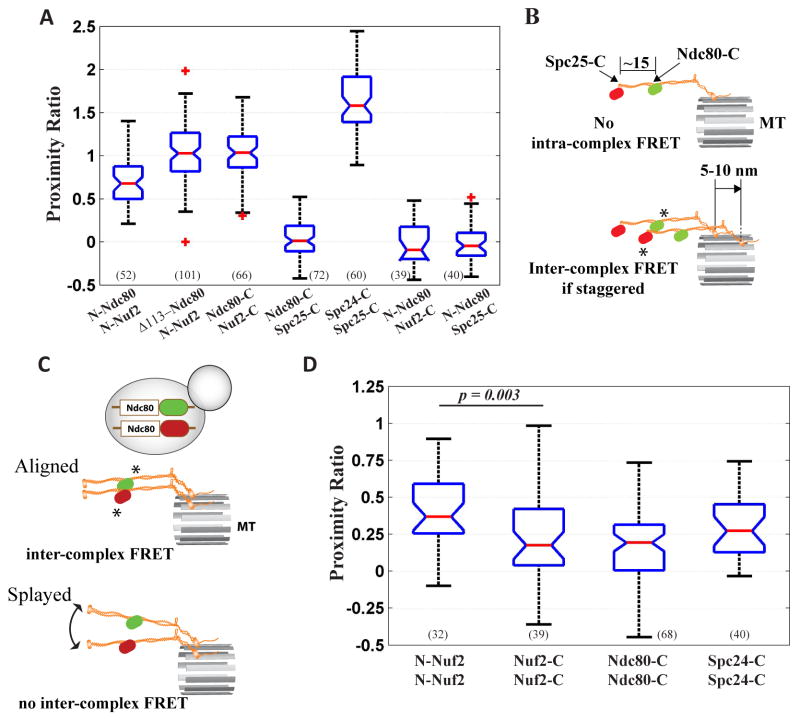
Figure 2. Distribution of Ndc80 complex molecules within the kinetochore.
(A) Box and whisker plot for proximity ratios quantifying FRET between Ndc80 complex subunits. The horizontal blue lines of each box represent the 25th and 75th percentile values, and the whiskers display the extreme values. Red line in each box indicates the median; red crosses display outliers. Non-overlapping notches on the box plots signify statistically significant differences in mean values (p < 0.05 using the Wilcoxon rank-sum test). The number of measurements for each dataset is indicated at the bottom. (B) If two Ndc80 complexes are staggered by distances > 10 nm along the length of the MT, then inter-complex FRET can occur between a GFP and mCherry on adjacent complexes (marked with asterisks). (C) Inter-complex FRET can be measured in heterozygous strains expressing one copy of the gene of interest labeled with GFP and the other with mCherry only if adjacent Ndc80 complexes are aligned with each other (FRET pair denoted by asterisks) and if they do not splay away from one another. (D) Proximity ratio quantification for inter-complex FRET between the labeled domains of neighboring Ndc80 complexes.

