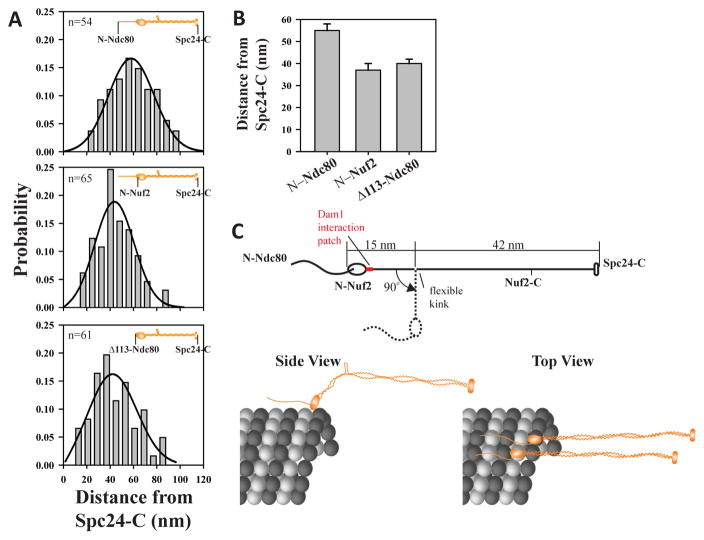
Figure 3. The Ndc80 complex bends in metaphase.
(A) Frequency distribution of the separation between the centroids of Spc24-mCherry and GFP-Ndc80, GFP-Nuf2, and GFP-Δ113-Ndc80 (indicated in the insets). Black curve is the non-Gaussian maximum likelihood fit [23]. (B) Average separation predicted by a non-Gaussian maximum likelihood fit (mean ± s. e. m.). (C) Metaphase architecture of the Ndc80 complex deduced from FRET and colocalization data.

