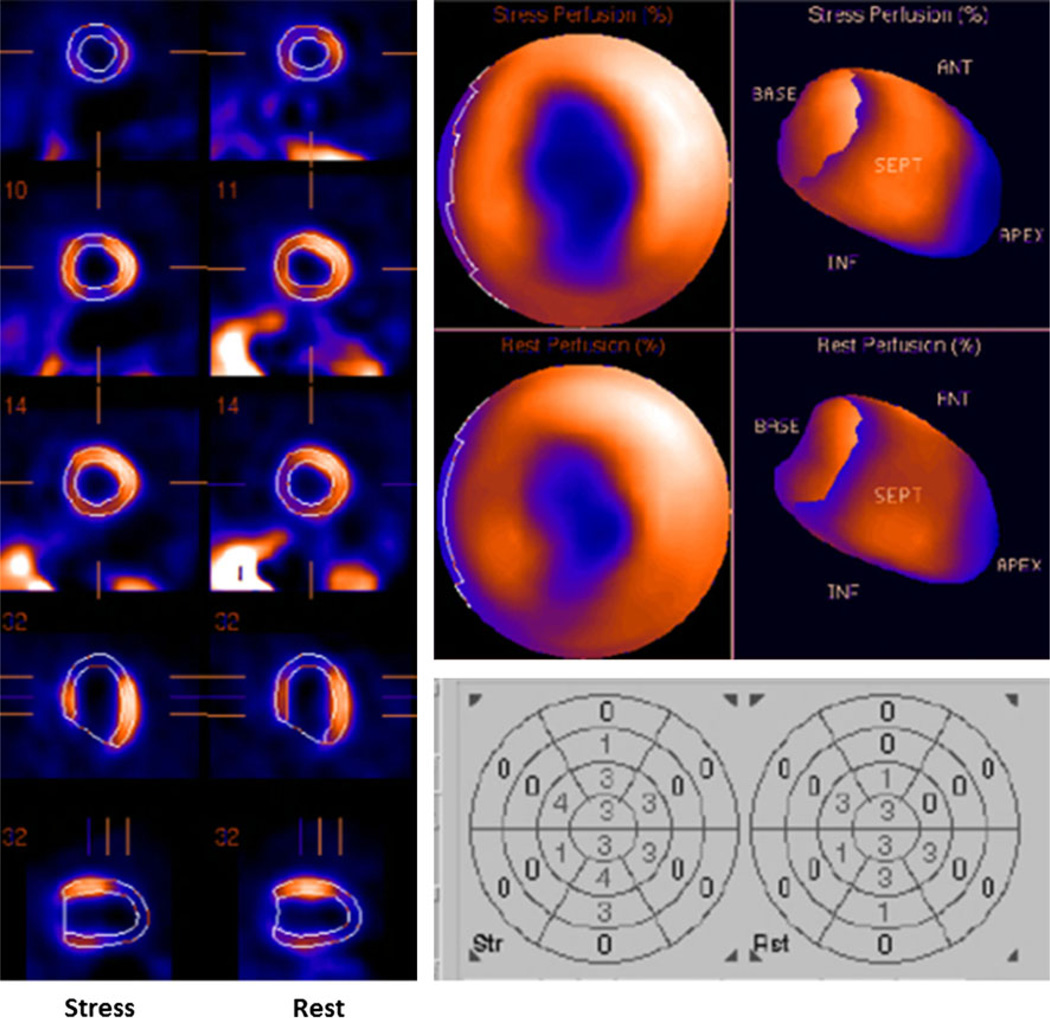
Figure 1.
Rest/vasodilator stress 99mTc-SPECT MPI. Left panel Representative tomographic images demonstrating an extensive persistent perfusion abnormality in the anterior wall extending to the anteroapex, suggesting infarction surrounded by borderzone ischemia. Top right Bull’s eye views (stress—top and rest—bottom) confirming similar findings. Bottom right Numeric scores for stress and rest perfusion defects. Summed stress severity score (SSS) = 27, summed rest severity score (SRS) = 17, summed difference severity score (SDS) = 8.

