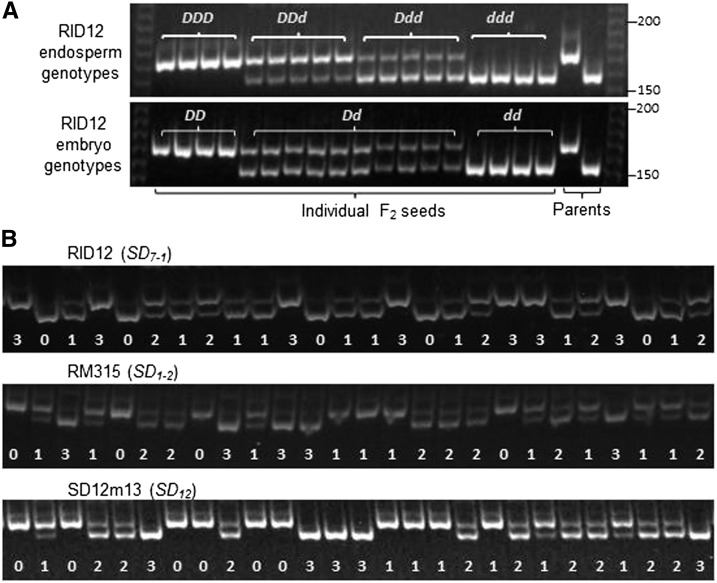
Figure 1.
Electrophoresis patterns of endosperm genotypes for codominant markers. (A) Comparison between endosperm and embryo genotypes of same seeds. (B) Segregation patterns for four endosperm genotypes of F2 seeds. RID12, RM315, and SD12m13 were selected to mark the seed dormancy loci SD7-1, SD1-2, and SD12, respectively. Gel images show electrophoresis patterns for individual F2 seeds from germinated subpopulations. The genotypes are indicated by combinations of the dormancy-enhancing (D) and/or -reducing (d) alleles, or by the copy number of the D allele (0−3) at a locus.

