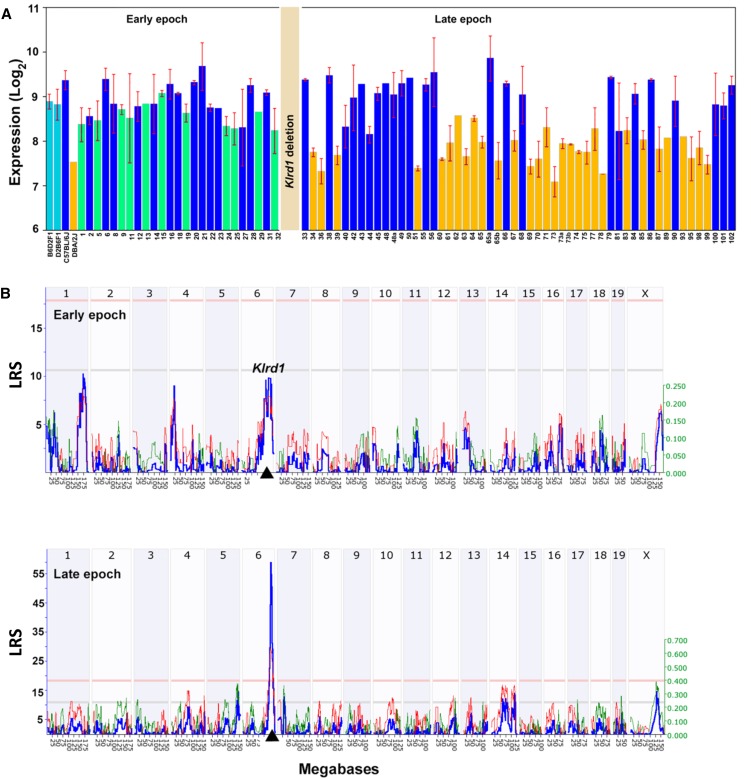
Figure 4.
Variation in Klrd1 expression in the spleen across BXDs. (A) Klrd1 expression differences between early and late epochs of BXDs. Early epoch consists of BXD strains (1 through 32) that were generated using D2 strain before the Klrd1 deletion. Late epoch consists of BXD strains (33 through 102) that have been generated using D2 strain with deleted Klrd1 locus. BXDs with the D2 haplotype at Klrd1 have been shown in green and orange colors in early and late epochs respectively. BXDs with B6 haplotype at Klrd1 in both epochs have been shown in blue color. (B) cis-acting expression quantitative trait locus mapping of Klrd1 expression using early BXD epoch (top) and the late BXD epoch (bottom). Expression variation in Klrd1 maps significantly to the location of the gene itself (black triangle on the x-axis) in late BXD epoch (likelihood ratio statistic, LRS ~60). The numbers along the top of each plot represent chromosomes. The y-axis and the bold blue function provides the likelihood ratio statistic (LRS = 4.6 × LOD (log of the odds ratio)). The two horizontal lines across these plots mark genome significance thresholds at P < 0.05 (genome-wide significant, red line) and suggestive threshold (P < 0.63, gray line). The thin red and green functions summarize the average additive effects of D and B alleles among all BXD strains at particular markers. If BXD strains with a D allele have higher values than those with a B allele at a particular marker then the line is colored green. In contrast, if strains with the B allele have greater mean values, the line is colored red. This additive effect size is measure in log2 units per allele. In other words, an additive effect of 0.5 signifies a two fold difference in expression level between strains with BB and DD genotypes at a marker (log 2 raised to the power of 2×0.5).

