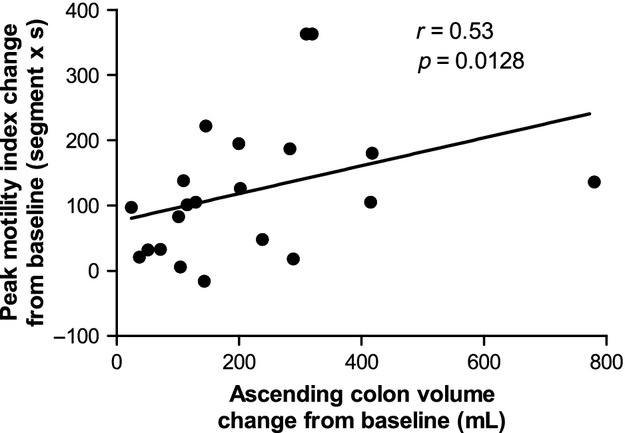
Figure 6.

Correlation between peak change from baseline ascending colon motility index (values are in segment × second) and change from baseline ascending colon volume (values are in mL). Data are from both groups of healthy volunteers who took the split 2 × 1 L dose or the single 2 L dose of PEG electrolyte.
