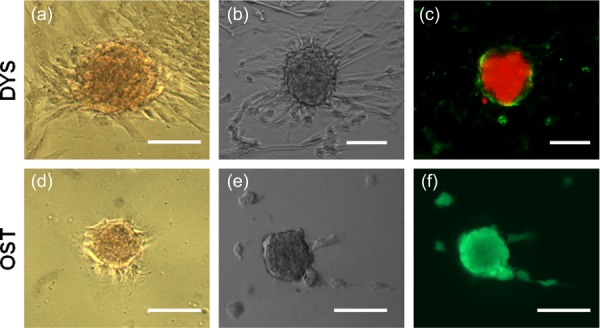
Fig. 1.

Dystrophic and osteogenic CNs exhibit differences in morphology and cell viability. (a) and (d) Dystrophic CNs and Osteogenic CNs stain positive for Alizarin Red. (b) and (e) Bright field images reveal morphological differences between dystrophic and osteogenic nodules. (c) Annexin/PI stain show strong uptake of PI stain in the nodule center with an Annexin V positive ring around dystrophic nodules while Calcein AM/PI stain show living cells within the osteogenic nodules and no uptake of PI stain. Scalebar = 100 μm.
