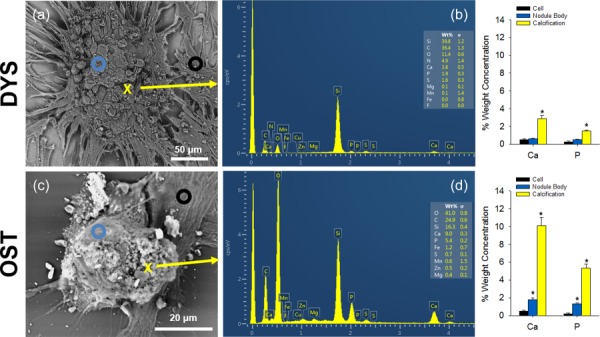
Fig. 2.

EDS reveals significant Ca and P content in CNs. (a) and (d) Backscattered SEM image of CNs with annotations showing regions of the nodules scanned with EDS. A black circle represents an EDS scan on cells; a blue circle represents an EDS scan on the nodule body; and a yellow X marks a point scanned to represent an area of calcification. (b) Representative EDS spectrum of a dystrophic nodule scanned at the yellow X in A. Ca and P scans show a weight percent of 2.8 and 1.5, respectively. (c) Relative percent weight concentration shows significantly higher amounts of Ca and P in regions of calcification. (e) Representative EDS spectrum of an osteogenic nodule scanned at the yellow X in D shows a weight percent of 10.1 and 5.3 for Ca and P, respectively. (f) Relative percent weight concentration shows dramatically higher levels of Ca and P in calcification regions. * indicates p ≤ 0.05
