Fig. 2.

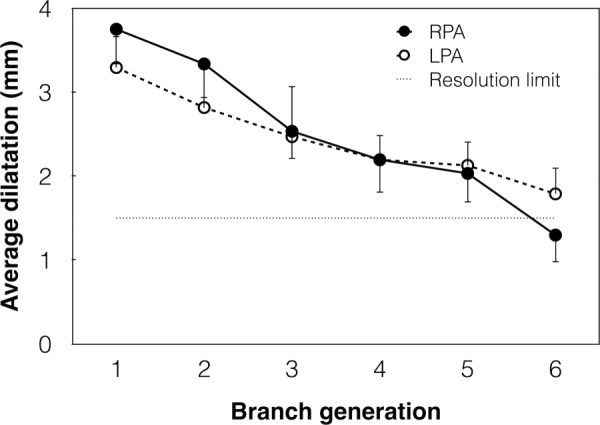
Change in average diameter of the six branch generations of RPA (solid line) and LPA (dashed line) from PRE to POST. Error bars show the SE. The straight dotted line represents the spatial resolution limit of CE-MRA (1.5 mm).

Change in average diameter of the six branch generations of RPA (solid line) and LPA (dashed line) from PRE to POST. Error bars show the SE. The straight dotted line represents the spatial resolution limit of CE-MRA (1.5 mm).