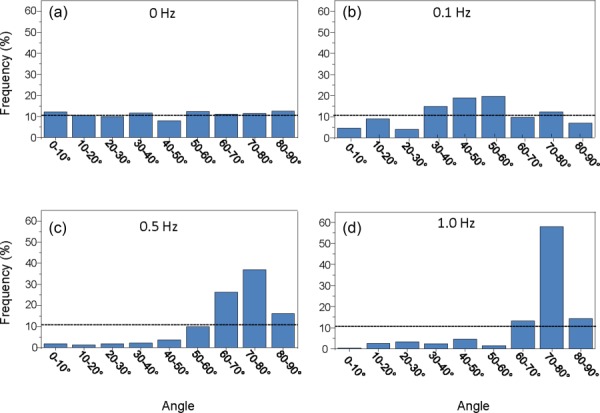
Fig. 3.

MSC alignment increased as a function of stretch frequency. MSC alignment distribution after 24 h of mechanical stimulation at (a) 0 Hz, (b) 0.1 Hz, (c) 0.5 Hz, and (d) 1 Hz frequencies shows an alignment shift toward the direction perpendicular to the axis of strain, as the strain frequency increases from 0 to 1 Hz. The dotted line depicts the frequency that would be expected at each angle grouping with random MSC alignment.
