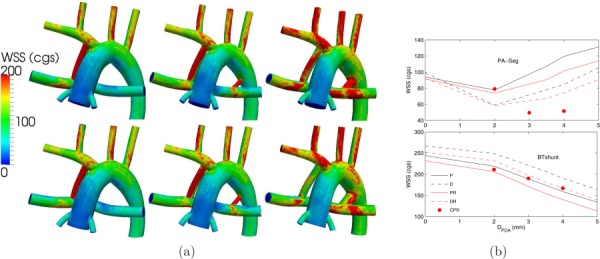
Fig. 9.

(a) WSS contours for normal PVR (top row) and high PVR (bottom row), and a single proximal MBTS (left column), a proximal MBTS and a 2 mm PDA (middle column), and a proximal MBTS and a 4 mm PDA (right column). (b) Spatially averaged WSS in the PA segment (top plot) and in the MBTS (bottom plot). See Fig. 5 caption for more details.
