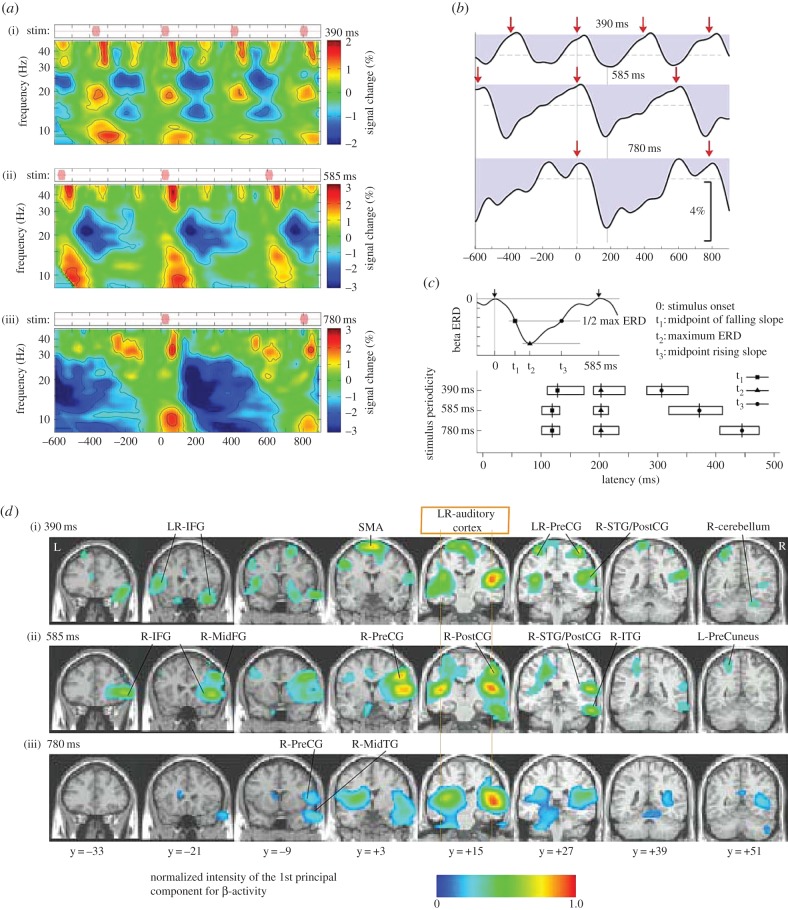
Figure 2.
Induced neuromagnetic responses to isochronous beat sequences at three different tempos. (a) Time-frequency plots of induced oscillatory activity in right auditory cortex between 10 and 40 Hz in response to a fast (390 ms onset-to-onset; upper plot), moderate (585 ms; middle plot) and slow (780 ms; lower plot) tempo (n = 12). (b) The time courses of oscillatory activity in the beta-band (20–22 Hz) for the three tempos, showing beta desynchronization immediately after stimulus onset (shown by red arrows), followed by a rebound with timing predictive of the onset of the next beat. The dashed horizontal lines indicate the 99% confidence limits for the group mean. (c) The time at which the beta desynchronization reaches half power (squares) and minimum power (triangles), and the time at which the rebound (resynchronization) reaches half power (circles). The timing of the desynchronization is similar across the three stimulus tempos, but the time of the rebound resynchronization depends on the stimulus tempo in a predictive manner. (d) Areas across the brain in which beta-activity is modulated by the auditory stimulus, showing involvement of both auditory cortices and a number of motor regions. (Adapted from Fujioka et al. [71].)

