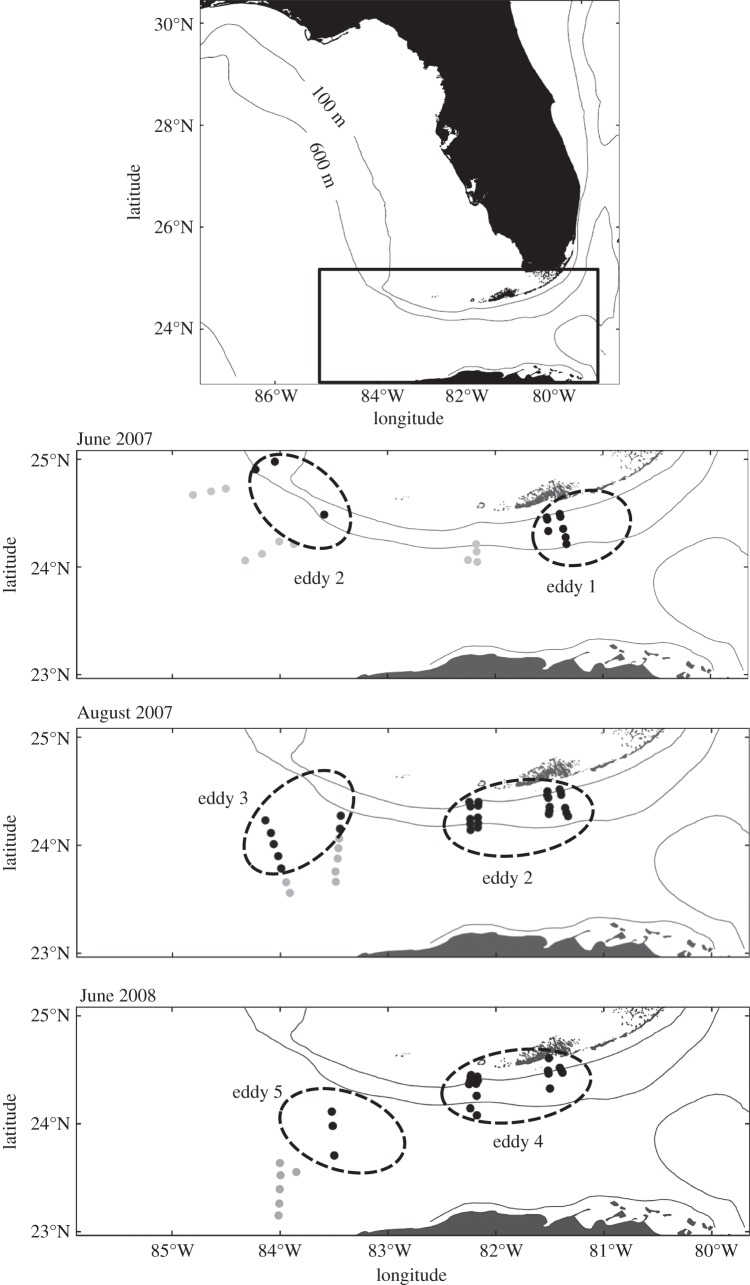
Figure 1.
Map of study area for each of the three sampling periods, indicating positions of mesoscale eddies (dashed lines) and locations of eddy (ED, black points) and non-eddy (NE, grey points) stations. Eddies are identified numerically in the order in which they propagated through the Straits of Florida.

