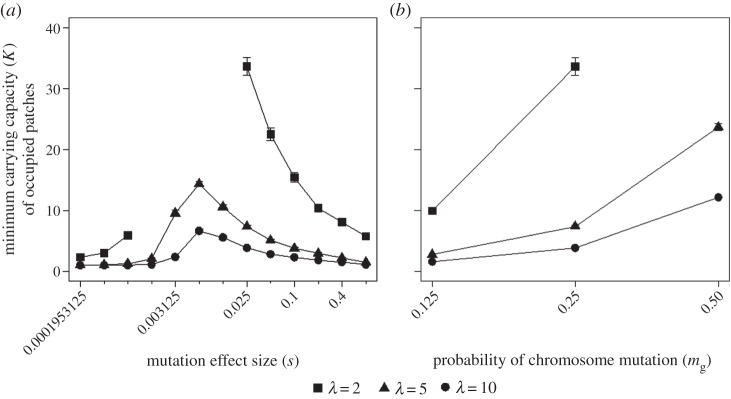
Figure 2.

Minimum K of occupied patches on the environmental gradient for (a) different mutation effect sizes (mg) and growth rates (λ), and (b) different probability of mutations (mg) and growth rates (λ), σ = 0.25 (m = 0.05). Points represent the mean and standard error over 30 replicates. Missing points are simulations with an unstable range extent resulting in extinction before generation 3000.
