
Figure 1.
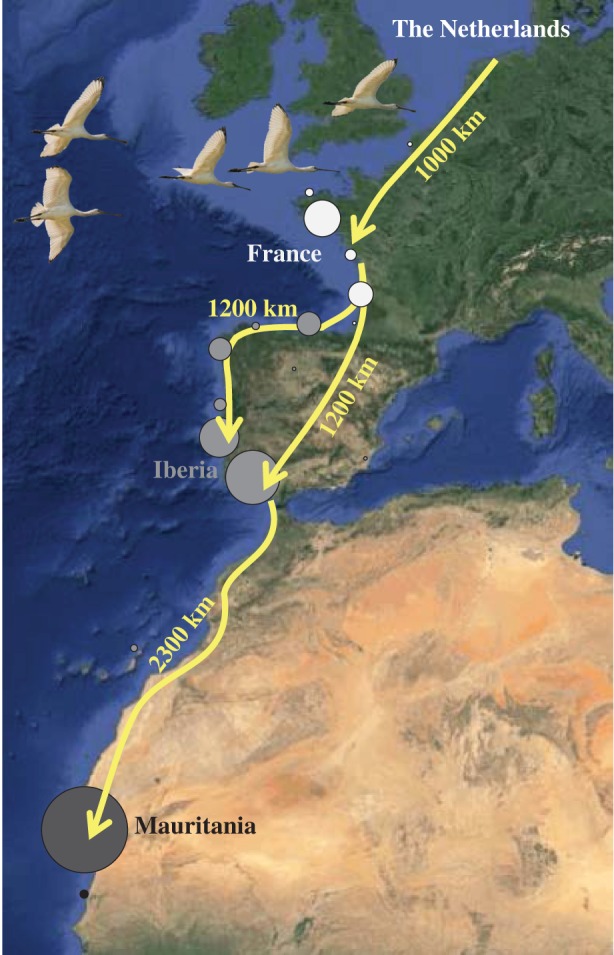
Map of spoonbill migration system. The sizes of the dots represent the number of individuals in the analysis that wintered at each site. (Online version in colour.)
Official websites use .gov
A
.gov website belongs to an official
government organization in the United States.
Secure .gov websites use HTTPS
A lock (
) or https:// means you've safely
connected to the .gov website. Share sensitive
information only on official, secure websites.
Map of spoonbill migration system. The sizes of the dots represent the number of individuals in the analysis that wintered at each site. (Online version in colour.)