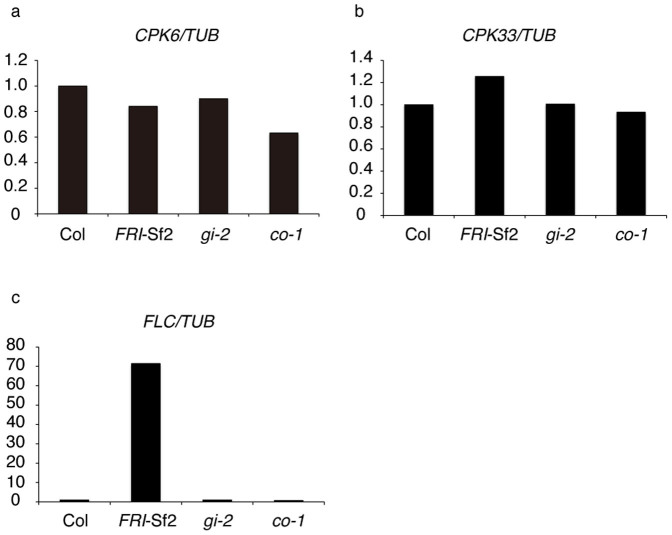
Figure 6. Expression of CPK6 and CPK33 in backgrounds with altered flowering regulators.
Relative levels of CPK6 (a), CPK33 (b), and FLC (c) mRNA in shoot apices. Expression levels were quantified by quantitative RT-PCR analysis. TUBULIN2/3 (TUB) was used as an internal control. Relative levels to that of Col (defined as 1) are indicated. Results of a single set of experiments are shown. Plants were grown under LD condition for 7 days. FRI-Sf2 is a Col line with a FRI allele (FRI-Sf2) from San Feliu-2 accession.

