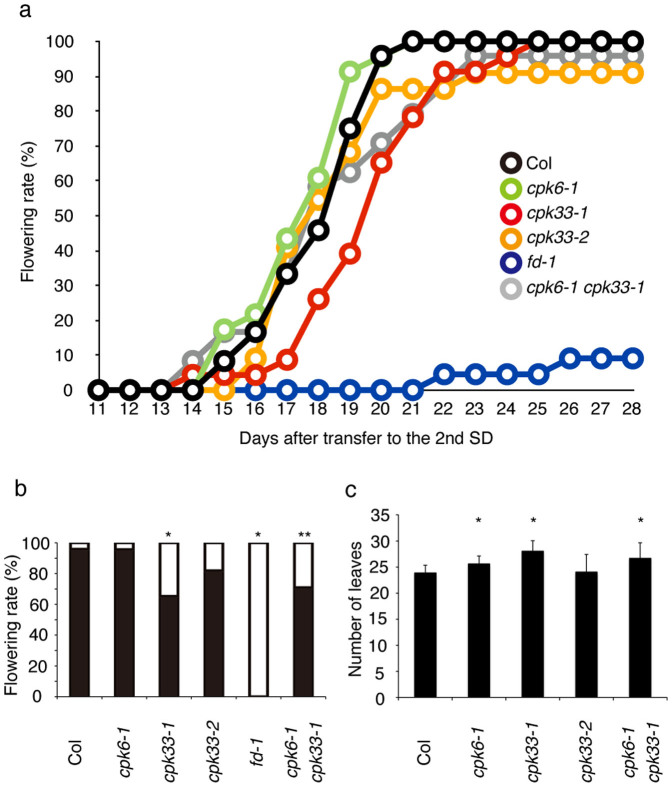
Figure 7. Effect of cpk mutations on flowering.
Plants (n = 22–24) grown in SD for 3 weeks were treated by 4 LDs, transferred back to SD (Supplementary Fig. S11a), and were examined daily for flowering. The number of rosette and cauline leaves was counted after flowering. (a) Cumulative rate of flowering plants. The horizontal axis indicates days after transfer to the 2nd SD. (b) Percentage of flowering (black) and non-flowering (white) plants 20 days after transfer to the 2nd SD. Asterisks above bar indicate statistically significant difference from Col (*: P < 0.01, **: 0.01 < P < 0.05, Fisher's exact test). (c) Flowering time as measured by the number of leaves at flowering (mean ± SD). An asterisk above bar indicates statistically significant difference from Col (P < 0.001, Student's t-test [two-tailed test]). Note that there is not statistically significant difference between cpk 33-1 and cpk6-1 cpk33-1 (P > 0.07, Student's t-test).

