
Figure 2. Normalized power dissipation in the fluid as a function of time, t.
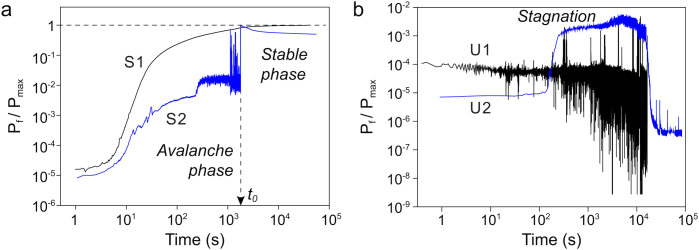
Concentration of nanotubes is 0.075 g/l. (a) Complete evolution: curve S1 (black), Rs = 10 MΩ, U = 75 V; curve S2, Rs = 10 MΩ, U = 325 V (blue). The time t0 is the time when the maximum possible dissipated power is achieved. (b) Incomplete evolution: curve U1, Rs = 100 MΩ, U = 5 V; curve U2, Rs = 2 MΩ, U = 300 V.