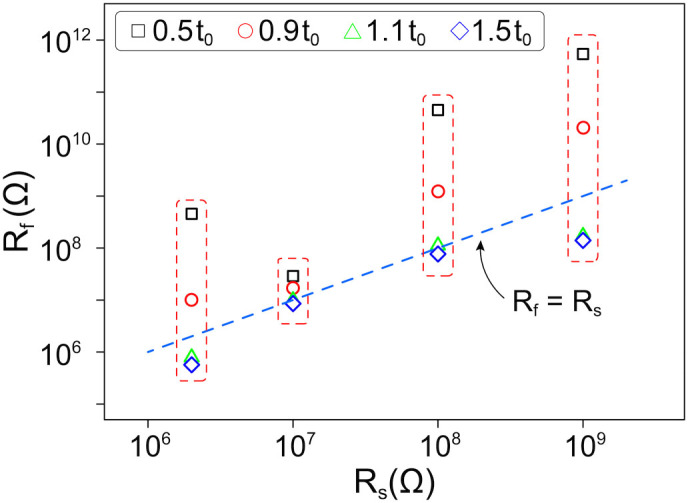
Figure 3. The resistance of nanotube chains formed in the fluid at different series resistances.

For each Rs four values of Rf are shown, measured at different times t. Blue diamonds represent the longest evolution time. Applied voltage is 150 V, concentration of nanotubes is 0.075 g/l. The blue dashed line corresponds to Rf = Rs, t0 is the time when P(t0)/Pmax = 1.
