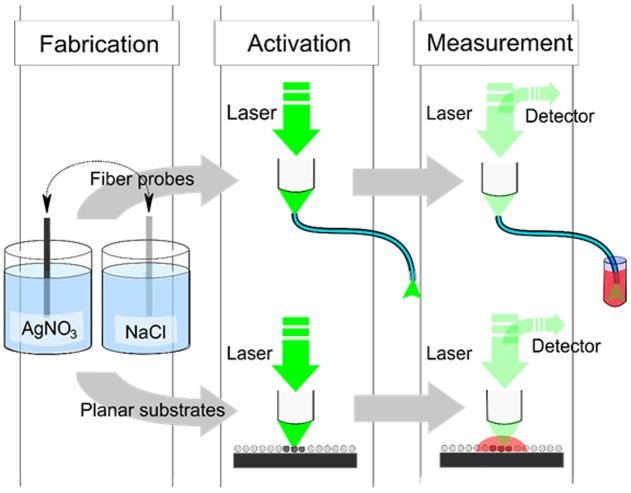
Figure 1. Schematic flow chart from the fabrication process to activation and SERS measurements.
After the fabrication, planar SERS substrates are activated and measured with a Raman microscope in a conventional manner while the SERS probes are activated and used in the measurements by coupling the laser light into the fiber using the microscope and recording the signal through the fiber.

