
Figure 4. Photoinduced collapse of AgCl crystals during the activation.
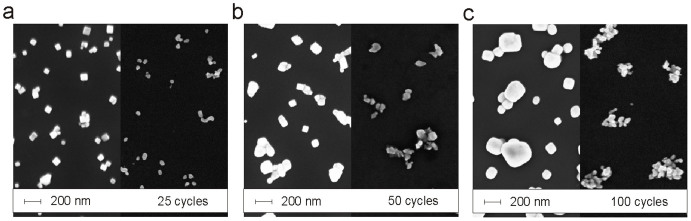
SEM images with a magnification of 25k× show the individual crystals grown on silicon wafer in (a) 25, (b) 50 and (c) 100 cycles before (left) and after (right) the activation.
Official websites use .gov
A
.gov website belongs to an official
government organization in the United States.
Secure .gov websites use HTTPS
A lock (
) or https:// means you've safely
connected to the .gov website. Share sensitive
information only on official, secure websites.
SEM images with a magnification of 25k× show the individual crystals grown on silicon wafer in (a) 25, (b) 50 and (c) 100 cycles before (left) and after (right) the activation.