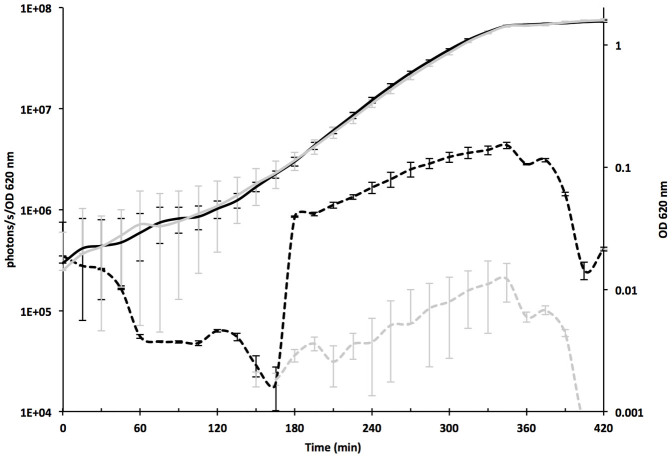
Figure 1. Performance of the PgelE and PfsrB promoters during the growth of E. faecalis SL11 (MMH594::pREG696luxPgelE, in black) and SL13 (MMH594::pREG696luxPfsrB, in grey) in GM17 medium.
The dotted lines indicate the promoter activity expressed as bioluminescence (photons/s) divided by the optical density (OD) at 620 nm, and growth is indicated by continuous lines and was measured as OD620. The values shown represent the averages of the results of three biological replicates ± standard deviation.

