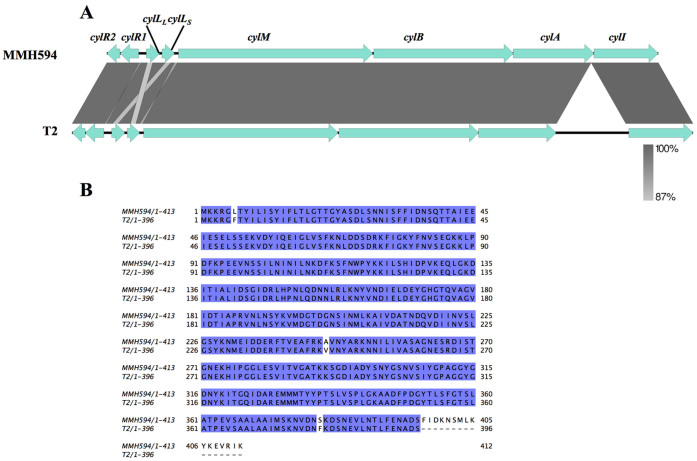
Figure 6.
(A) Alignment of the cyl operons of E. faecalis MMH594 and T2. A BlastN comparison was performed using EasyFig version 2.1 software. The levels of similarity ranged from 100 to 87%, as shown in the grey gradient scale. The light blue arrows indicate the genes. (B) Comparison of CylA sequences of MMH594 and T2. The conserved residues are highlighted in blue. The alignment was conducted using the MAFFT alignment program.

