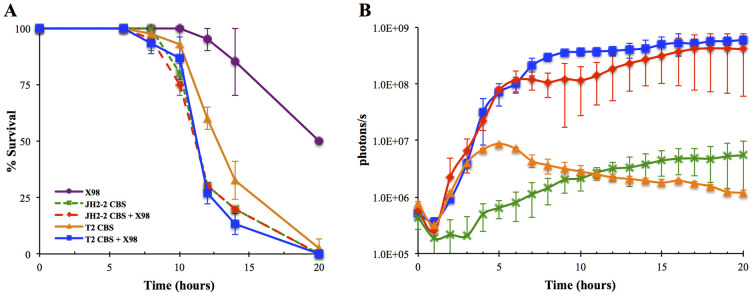
Figure 8. G. mellonella larvae were injected by E. faecalis ×98 (purple), T2 CBS (orange), JH2-2 CBS (green), and a mixed suspension of either ×98 + T2 CBS (blue) or ×98 + JH2-2 CBS (red).

(A). Survival curves of G. mellonella larvae following infection with E. faecalis. Co-infection by T2 CBS and ×98 caused increased killing to that resulting by T2 CBS mono-infection, (P = 0.015, chi-square test with 1 degree of freedom, T2 CBS + ×98 versus T2 CBS). The plots display the averages of results of triplicate independent experiments. For each assay, 10 insects were used. (B). Real-time monitoring of CylLS expression during the progression of an E. faecalis infection in intact insects. For tracking bacterial infection in G. mellonella, five individual insects were injected and placed in duplicate in a 4.0 cm Petri dish. Plates were kept at 37°C in the chamber of the Xenogen IVIS Lumina II imaging system (Caliper Life Sciences, CA). Bioluminescence was recorded at 30 minutes intervals for 20 hours.
