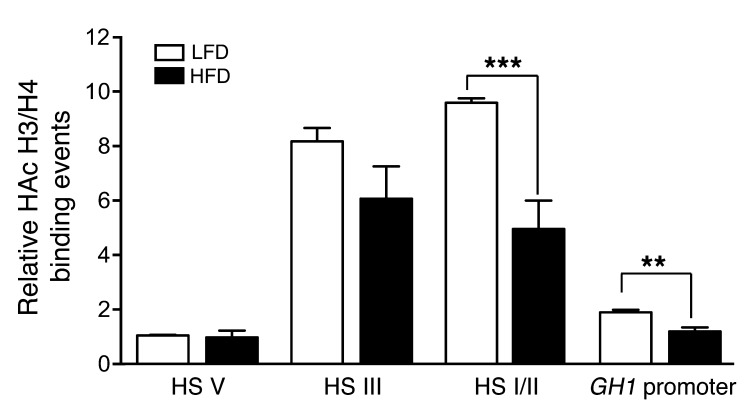
Figure 5. Histone H3/H4 hyperacetylation is reduced by excess caloric intake at the HS I/II and GH1 promoter regions.
Relative levels of hyperacetylated (HAc) histone H3 and H4 in pituitary chromatin from HFD- or LFD-fed 171hGH/CS-TG mice, assessed by ChIP-qPCR. Input and immunoprecipitated (bound) chromatin fractions were assessed using specific PCR primer sets for upstream HS V, HS III, HS I/II, and proximal (–0.5 kb) GH1 promoter regions. Results are expressed relative to LFD group HS V value (arbitrarily set to 1). Significance was assessed by 1-way ANOVA with Bonferroni post-test (n = 6). **P < 0.01, ***P < 0.001.

