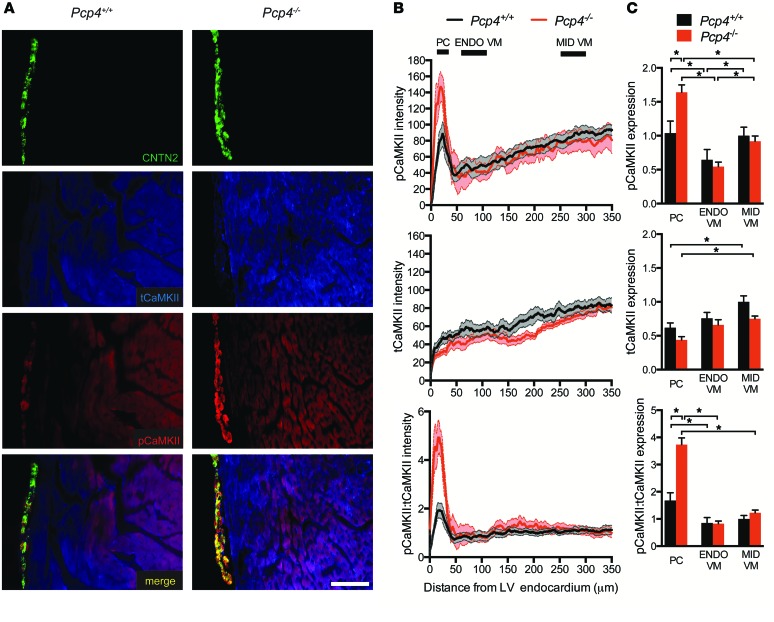
Figure 3. Transmural expression patterns of tCaMKII and pCaMKII in Pcp4-null and control hearts.
(A) Representative immunofluorescence staining of tCaMKII and pCaMKII in Pcp4-null and control hearts. CNTN2 expression identifies PCs. (B and C) Quantitative assessment of the abundance of pCaMKII and tCaMKII and the ratio of pCaMKII/tCaMKII as assessed by pixel intensity. (B) Intensity measurements were plotted (in arbitrary units) as a function of distance from the endocardium in the left ventricular free-wall myocardium. (C) Comparison of intensity measurements (plotted in arbitrary units) within distinct compartments of Pcp4-null and control animals: Purkinje network (PC; 10–40 μm from endocardium), subendocardial VMs (ENDO VM; 75–125 μm from endocardium), and midmyocardial VMs (MID VM; 250–300 μm from endocardium). Scale bar: 100 μm. Data represent mean ± SEM. *P < 0.05.

