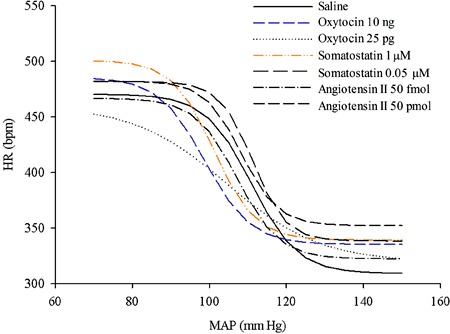
Figure 3. Plots showing the average values for the relationship between mean arterial blood pressure (MAP) and heart rate (HR), using logistic sigmoidal baroreceptor curve analysis, of rats that received the following microinjections in the posterodorsal medial amygdala: saline (0.3 µL, n=7), oxytocin (10 ng/0.3 µL and 25 pg/0.3 µL, n=6 in both groups), somatostatin (1 µM/0.3 µL, n=8 and 0.05 μM/0.3 µL, n=5), or angiotensin II (50 pmol/0.3 µL and 50 fmol/0.3 µL; n=7 in both groups).

