. 2014 Nov 21;48(2):128–139. doi: 10.1590/1414-431X20144095

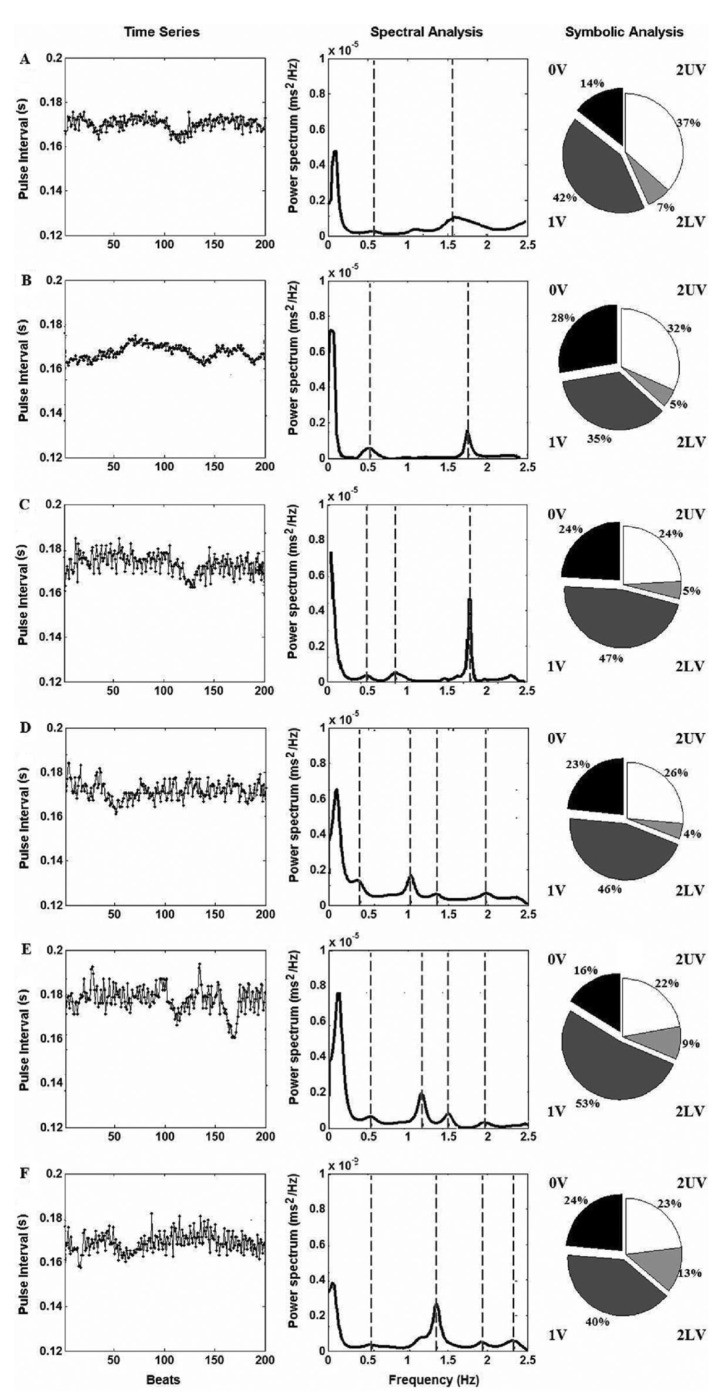
Figure 5. Power spectrum and symbolic analysis applied to a time series of cardiovascular parameters of rats. The columns show the pulse interval series, power spectrum and the symbolic pattern distribution for the data obtained from the experimental groups that received microinjections into the posterodorsal medial amygdala with A, saline (0.3 µL, n=7), B, oxytocin 10 ng and C, 25 pg (n=6 in both groups), D, somatostatin 1 µM (n=8) and E, 0.05 μM (n=5), or F, angiotensin II 50 pmol (for the power spectral analysis) and 50 fmol (for the symbolic analysis; n=7 in both groups). Values are from representative samples of each experimental group. Mean values for all studied animals are shown in Tables 2 and 3.

Figure 5