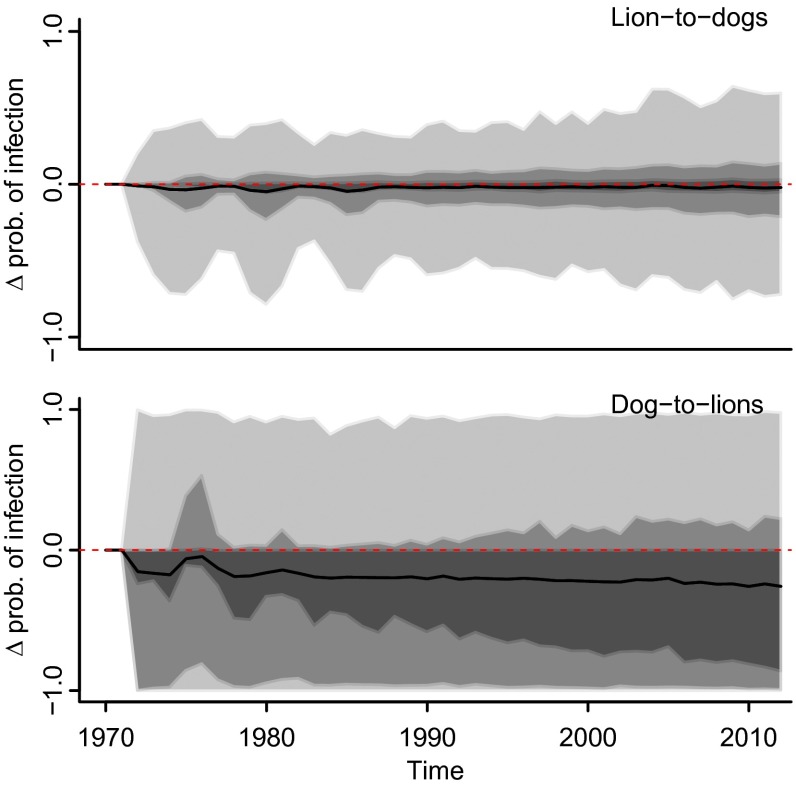
Fig. 5.
Sensitivity analysis results for the cross-species transmission parameter showing the difference between the probability of dog infection predicted with and without lion-to-dog transmission (Upper) and between the probability of lion infection predicted with and without dog-to-lion transmission (Lower). Shaded areas around the mean (black line) correspond to 50% (dark gray), 75% (medium gray), and 95% (light gray) CIs.

