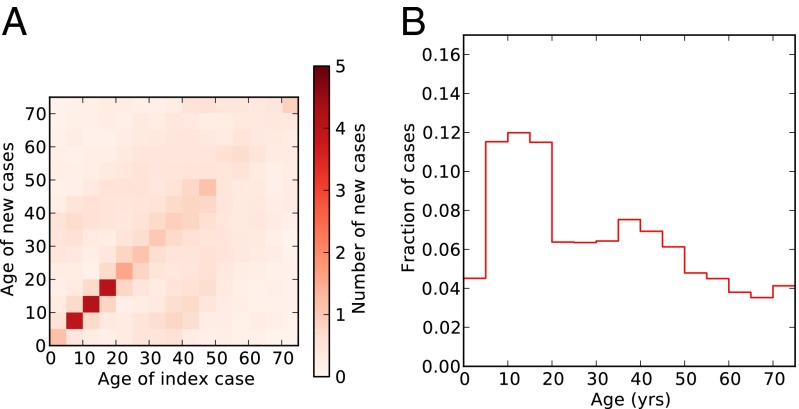
Fig. 5.
Contact structure. (A) Heat map shows the next-generation matrix: the number of cases in each age group expected to result from an index case in a given age group, with the column indicating the age group of the index case, the row indicating the age group of the resulting new cases, and shading indicating the number of cases (darker red for more cases). (B) Leading eigenvector (corresponding to eigenvalue 7.40) of the contact matrix (i.e., the age distribution of cases expected to replicate most quickly while retaining the same age distribution).

