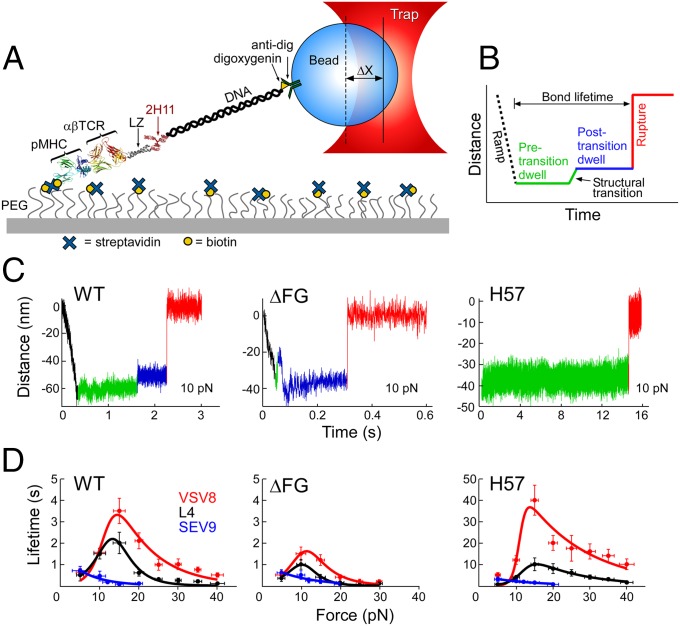
Fig. 2.
SM studies. (A) Cartoon showing single-molecule tether assay for probing the lifetime of αβTCR–pMHC bonds. “ΔX” denotes displacement of bead out of the center of the trap. (B) Loading profile for measuring bond lifetime. Increase in distance represents greater separation along the system path. An initial ramp phase, indicated by a black dashed line, loads the tether to a fixed force, “Pre-transition dwell,” indicated by a green line. Frequently, a signature structural transition is observed, indicated by green to blue line, followed by a “Post-transition dwell,” in blue. “Rupture,” indicated by red line, is seen as an abrupt upward step. (C) Representative traces at 10 pN for WT, ΔFG, and H57 Fab. The WT trace shows a typical transition and rupture. ΔFG traces typically transition early, here occurring during the initial ramp phase. H57 Fab traces typically show no transition and dwell for longer periods before rupture. Low-amplitude motions in the green baseline (see WT) were also observed. (D) Force-bond lifetime plots for WT, ΔFG, and H57 Fab showing catch bonds for both VSV8 and L4 and slip bond character for SEV9. Catch bonds peak at ∼15 pN for WT and shift to lower force for ΔFG with significant reduction in bond lifetime. H57 stabilized the FG loop exhibiting dramatic amplification of catch bond lifetimes.

